Debugging a Flex Plugin with VS Code
This guide shows how to set up Visual Studio Code (VS Code) to debug your Flex Plugin locally using the built-in VS Code debugger, so you can set breakpoints and step through your application. This tutorial builds off of the Plugin from the Plugin Development Quickstart.
This tutorial requires that you have an existing Flex Plugin and that you already have VS Code installed on your operating system.
Open your Plugin folder in VS Code, then switch to the Debugger panel. If no launch.json file exists yet, click the Run and Debug button and select Web App (Chrome). This automatically creates a launch.json inside the .vscode folder and opens the file for you.
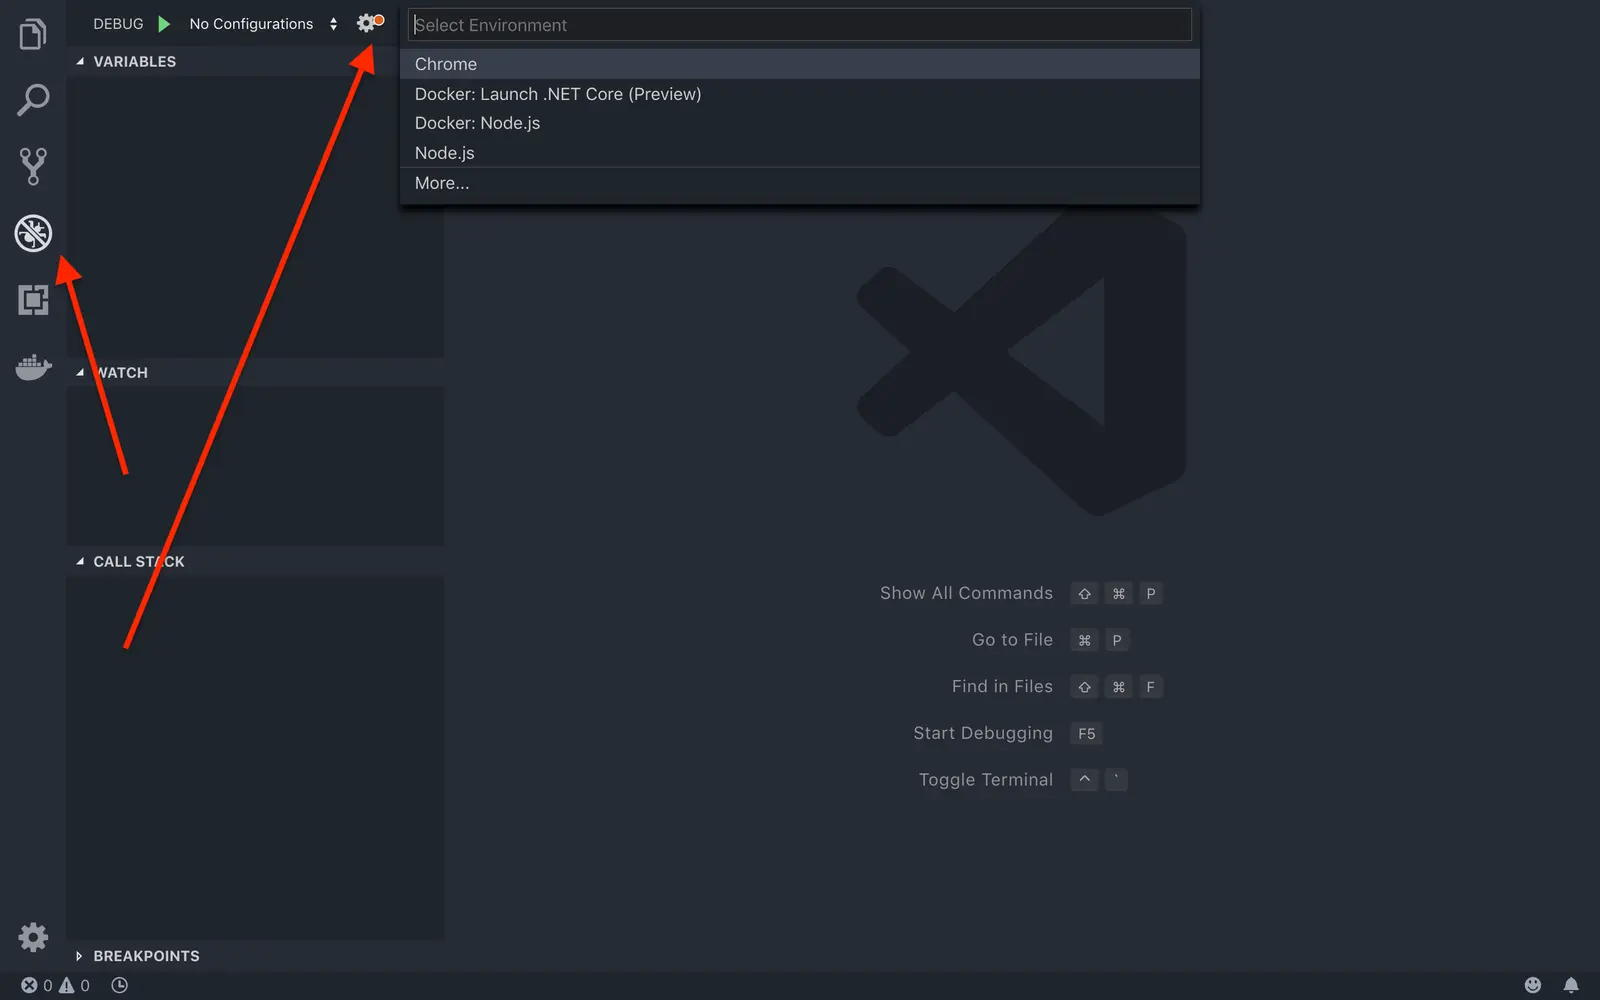
Then, replace the value of URL in launch.json with http://localhost:3000 and save the file.
With the debugger configured, run your dev server and launch the debugger.
First, start your Flex plugin using twilio flex:plugins:start. You may close the browser that this script starts as we'll launch another one shortly.
Next, go to the Debugger panel of your VS Code again. This time, in the dropdown menu, you should see a Chrome or Launch Chrome option. Make sure it is selected, and press the green play button.
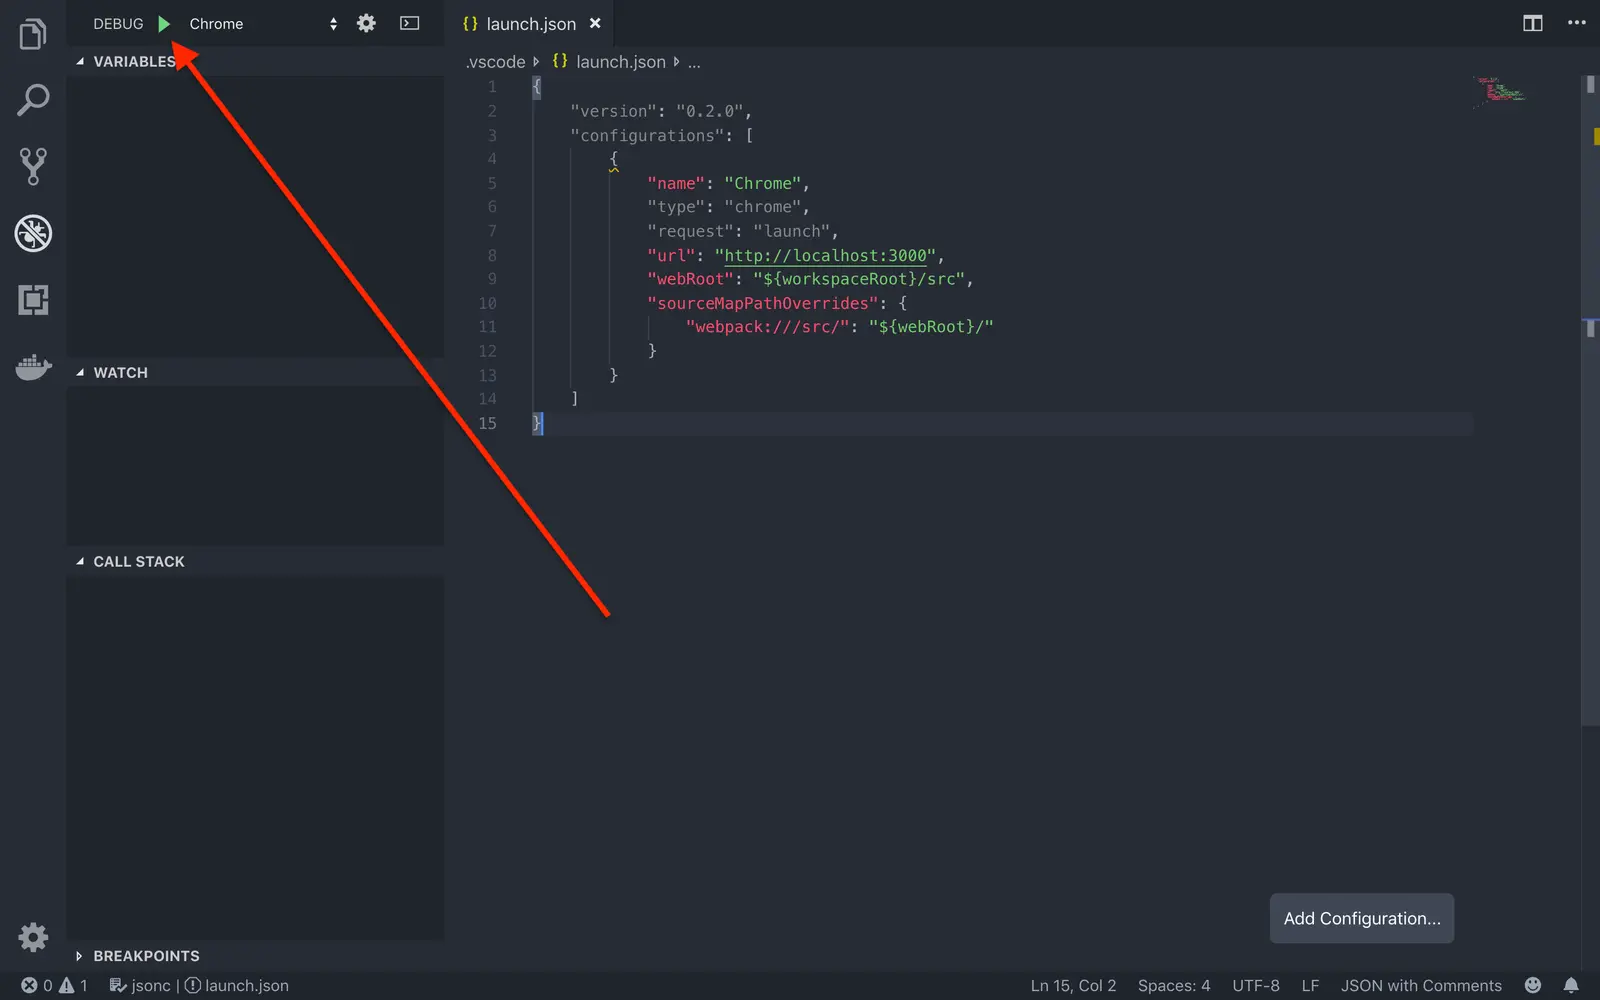
This will launch a new Chrome page and start your application. You can now log into your Flex instance.
While running in debug mode, you will see a debugger toolbox in the top center of the VS Code editor.

Open the file where you'd like to set a breakpoint. Hover your cursor to the left of the line number. A little red dot should appear. Click to place the breakpoint. Now, click the green "refresh" button on the toolbox to restart the app.
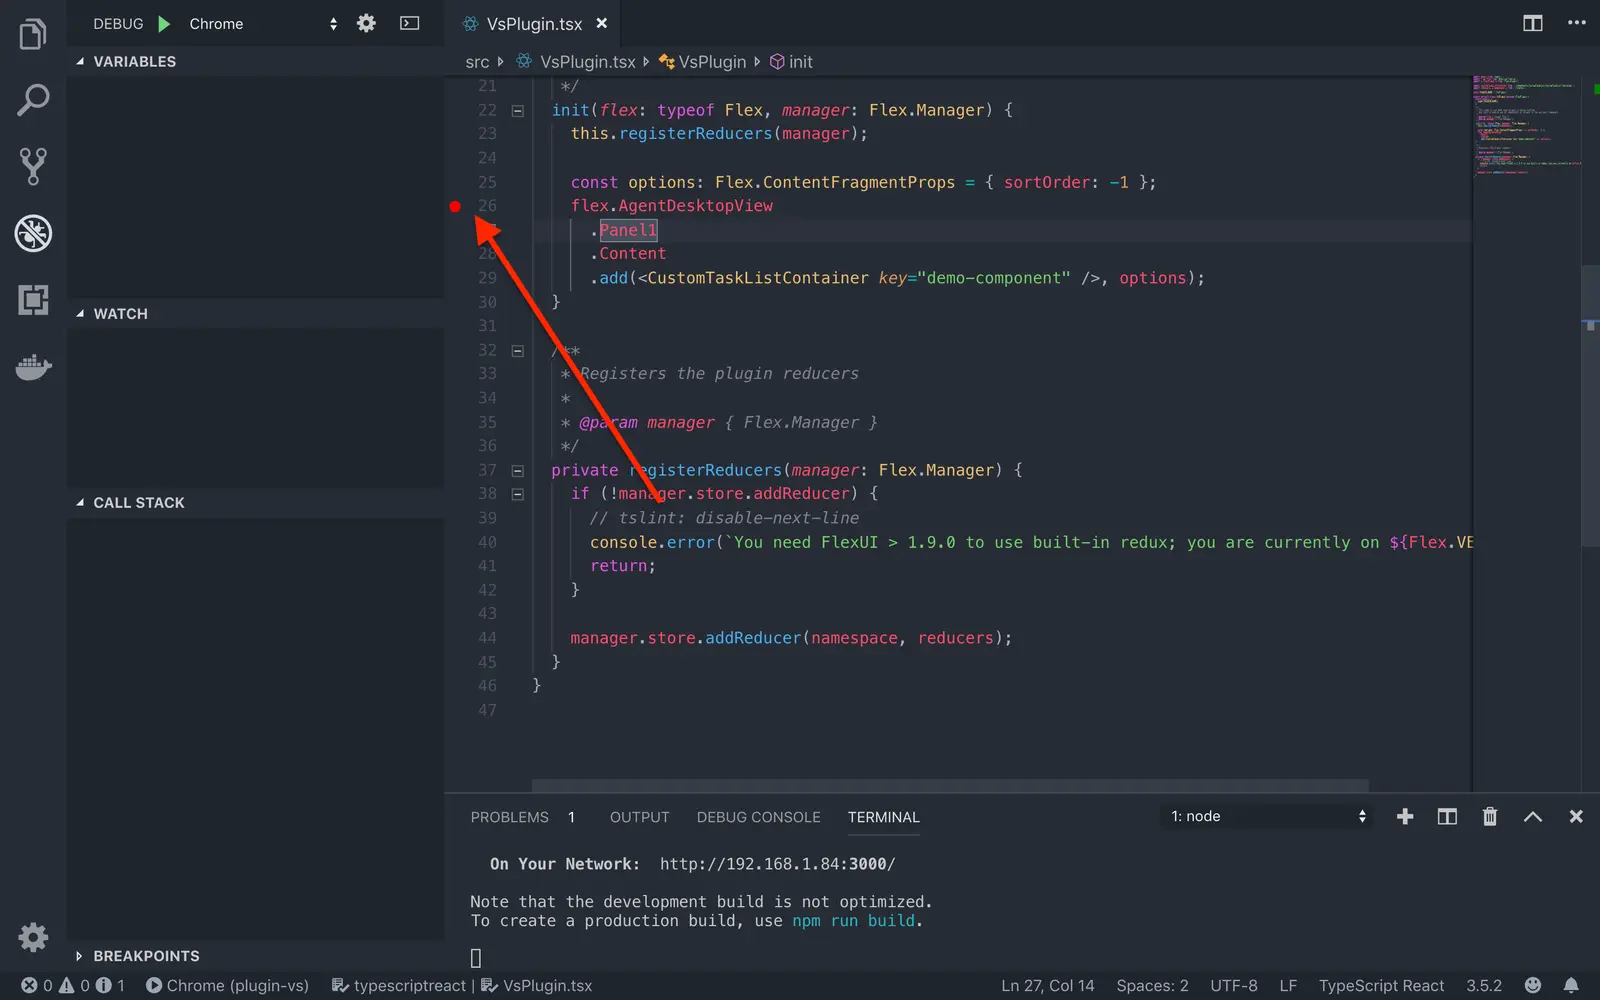
You now have a breakpoint at this step of your application. You can see the variables and the call stack, as well as step into the methods.